The 30% federal solar tax credit for homeowners ends on December 31, 2025. See which states will be hit hardest, how many credits were claimed in 2023, how electricity rates compare, and what happens next.
The Residential Solar Tax Credit Is Ending: What That Means for Homeowners Across the U.S.
The federal residential solar tax credit (officially the Residential Clean Energy Credit, Section 25D) has been the single most important incentive for homeowners to install solar panels. Worth 30% of project costs, it has saved families tens of thousands of dollars on clean energy investments.
But this credit is set to end on December 31, 2025. That deadline means households, state programs, and the solar industry are bracing for big changes.
In this blog, we’ll cover:
- Key facts about the residential solar tax credit
- The states that will be most affected, with 2023 data on credits claimed
- Residential electricity price rates in those states & expected increases
- What homeowners should do before the deadline
- What happens next once the credit is gone
Key Notes About the Residential Solar Tax Credit
- Provides 30% of eligible costs (solar panels, energy storage batteries installed with solar, etc.).
- Systems must be installed and placed in service by December 31, 2025, to qualify.
- The credit is non-refundable, but can be rolled forward if you don’t have enough tax liability in one year.
- There’s no gradual step-down — the residential credit ends completely after 2025.
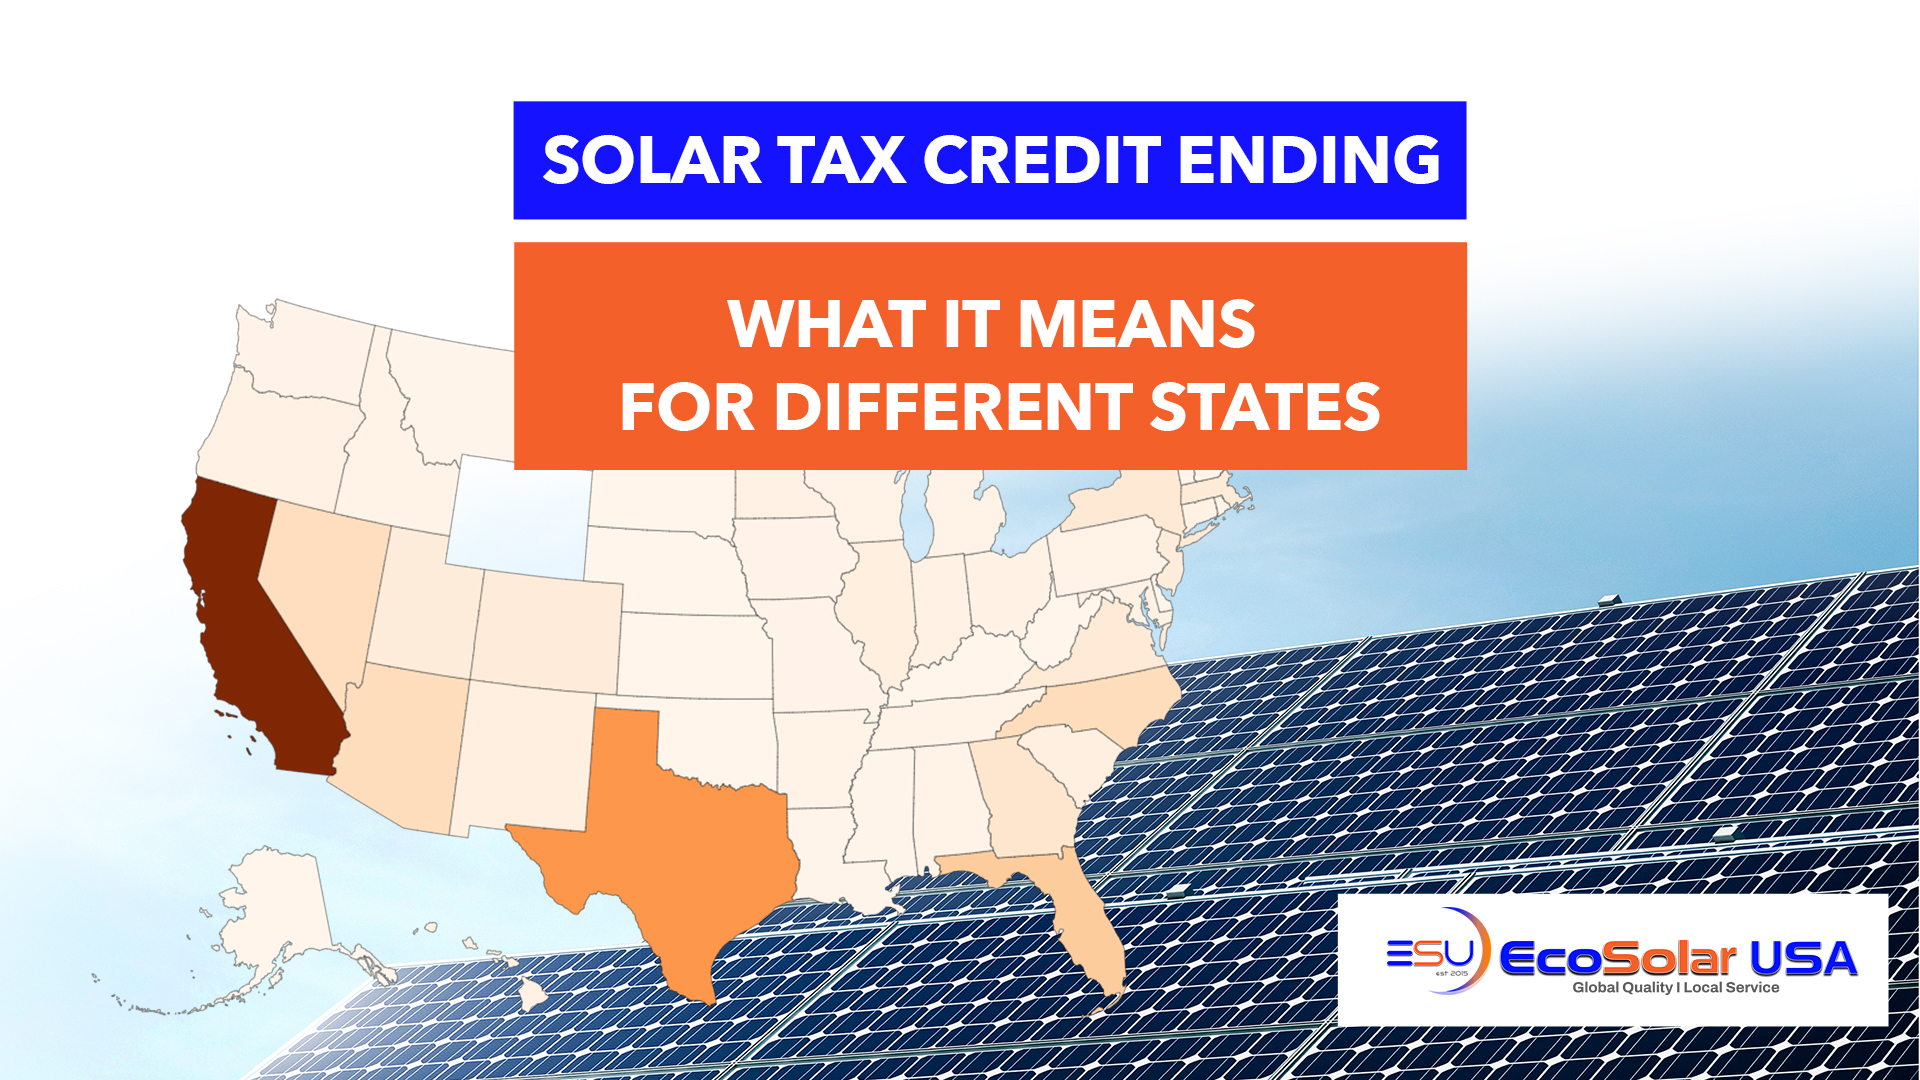
States Most Affected by the Ending Solar Tax Credit
Every state will feel some effect, but those that rely heavily on the federal incentive will be hit the hardest. Factors include:
- Few or no state/local solar incentives
- Higher solar installation costs
- Large populations of homeowners already investing in solar
Table 1: Solar Tax Credit Claims and Payback Impacts by State (2023)
| State | 2023 Claims | Solar Jobs | Payback w/ Credit (yrs) | Payback w/o Credit (yrs) |
| Texas | 186,500 | 12,421 | 10.7 | 15.3 |
| Arizona | 47,910 | 9,726 | 10.3 | 14.8 |
| Pennsylvania | 30,670 | 4,287 | 9.2 | 13.1 |
| Colorado | 30,400 | 8,177 | 9.3 | 13.2 |
| Virginia | 27,250 | 4,938 | 10.9 | 15.5 |
| Ohio | 16,520 | 7,788 | 13.1 | 18.8 |
| Michigan | 13,570 | 4,329 | 13.2 | 18.9 |
| South Carolina | 12,830 | 3,472 | 12.2 | 17.4 |
| Minnesota | 8,740 | 4,795 | 9.3 | 13.3 |
| Oklahoma | 8,090 | 947 | 9.3 | 13.3 |
| Wisconsin | 7,860 | 3,253 | 9.1 | 13.0 |
| Iowa | 6,880 | 898 | 9.9 | 14.2 |
| Kentucky | 5,590 | 1,701 | 13.2 | 18.9 |
| Kansas | 4,570 | 1,082 | 14.3 | 20.4 |
| Delaware | 3,720 | 600 | 9.3 | 13.2 |
| Montana | 2,680 | 374 | 11.5 | 16.5 |
| West Virginia | 1,640 | 395 | 9.4 | 13.4 |
| Wyoming | 910 | 177 | 10.4 | 14.9 |
| South Dakota | 850 | 520 | 14.6 | 20.8 |
Electricity Rates by State & Forecasted Trend
To understand how the ending tax credit will affect homeowners, it helps to know how electricity prices vary by state, and how they are expected to trend upward. Solar becomes more attractive when electricity costs are high or rising.
Table 2: Residential Electricity Rates in 2025 for Most Affected States
| State | Avg. Residential Rate (¢/kWh) | Annual Change (vs 2024) |
| Texas | ~15.23 | +4.6% |
| Arizona | ~13.79 | +3.8% |
| Pennsylvania | ~17.39 | +6.9% |
| Colorado | ~14.27 | +5.5% |
| Virginia | ~15.01 | +6.2% |
| Ohio | ~16.21 | +4.4% |
| Michigan | ~17.55 | +5.2% |
| South Carolina | ~15.80 | +4.9% |
| Minnesota | ~14.96 | +3.6% |
| Oklahoma | ~12.63 | +4.1% |
| Wisconsin | ~17.12 | +5.3% |
| Iowa | ~13.88 | +3.5% |
| Kentucky | ~13.76 | +4.7% |
| Kansas | ~14.52 | +5.8% |
| Delaware | ~16.88 | +5.6% |
| Montana | ~12.42 | +3.9% |
| West Virginia | ~13.91 | +4.2% |
| Wyoming | ~12.11 | +2.8% |
| South Dakota | ~12.84 | +3.3% |
(Rates from EIA/ChooseEnergy, mid-2025 averages)
National Trends & Projections
- The national average residential electricity price is ~17.5 ¢/kWh as of mid-2025, up ~13% since 2022.
- Forecasts suggest continued increases of 13%–18% by 2026, depending on region.
- Utilities in many states (e.g., California, New England) have already filed for further 2025–2026 rate hikes, often between 5%–12% annually.
Why This Matters
- In high-cost states (California, Massachusetts, New York, etc.), solar’s value comes from offsetting expensive utility power.
- Rising electricity rates mean the savings gap widens over time — but without the tax credit, upfront affordability becomes the main barrier.
- Homeowners in medium-cost states (Texas, Virginia, Colorado) will still see benefits, but payback times lengthen without the credit.
What Homeowners Should Do Now
- Act quickly — start the permitting and installation process so your system is placed in service before the end of 2025.
- Compare quotes — electricity rates vary widely by state, so your ROI depends on your local utility costs.
- Leverage financing — solar loans or leases can help bridge the gap after the credit ends.
- Look for state/local incentives that could soften the impact once the federal program expires.
What Happens Next
- Starting in 2026, the residential solar tax credit ends completely.
- Commercial systems retain a credit under different rules, but homeowners lose the 30% benefit.
- Some states may expand their own tax credits, rebates, or net metering programs to soften the impact.
- As electricity prices continue to rise, solar and battery systems will remain a hedge — though with higher upfront costs.
Final Words
The federal solar tax credit has helped millions of American households invest in clean energy. Its scheduled expiration on December 31, 2025, comes at a time when electricity prices are rising rapidly nationwide.
States like Texas, Pennsylvania, Colorado, Virginia, Michigan, and others with tens of thousands of credits claimed will be hit hardest. While solar will remain valuable in the long term (especially as rates increase), the loss of the credit means higher upfront costs and longer payback times.
If you’re considering solar, 2025 is the year to act.